
Java JIT optimizations - Inline
Published on
Inlining is one of the most aggressive and rewarding optimizations performed by the HotSpot JIT compiler. It replaces a method call with the actual body of the method called, eliminating dispatch overhead and enabling further optimizations. But not all method calls are inlined, and understanding why requires diving deep into how the compiler makes these decisions.
Both C1 and C2 JIT compilers perform inlining at certain points. For the purposes of this discussion, we will treat inlining as a unified concept, with little to no distinction between the two compilers.
Inlining overview
In short, inlining means that JIT, through its C1 and C2 compilers, replaces method calls (named callee) with their bodies at the call site. Let’s take a look at a very simple example:
In the above example, the body of the process(int) callee method will be copied to the withInlining() call site method, effectively obtaining:
An important note is that the JIT compiler performs these optimizations on the bytecode (as input) and obtains the native machine code (as the output). Thus, inlining and other such optimizations will only be visible in the native code, not the actual Java code or bytecode.
This optimization technique produces several immediate low-level benefits:
- Elimination of method selection which, depending on class design, might be simple, might be complex;
- Elimination of call instructions: No
invokevirtual,invokestaticor other method invocations are translated to native machine code; - No stack frame setup or teardown: Reduces the cost of creating and destroying stack frames for the inlined call;
- No parameter passing overhead: Arguments do not need to be pushed to the call stack or moved between registers.
In addition to this complexity removal, inlining serves as a gateway optimization, i.e. it unlocks further compiler optimizations that may not be possible across method boundaries, optimizations like constant folding, dead code elimination or escape analysis.
Simple inlining performance
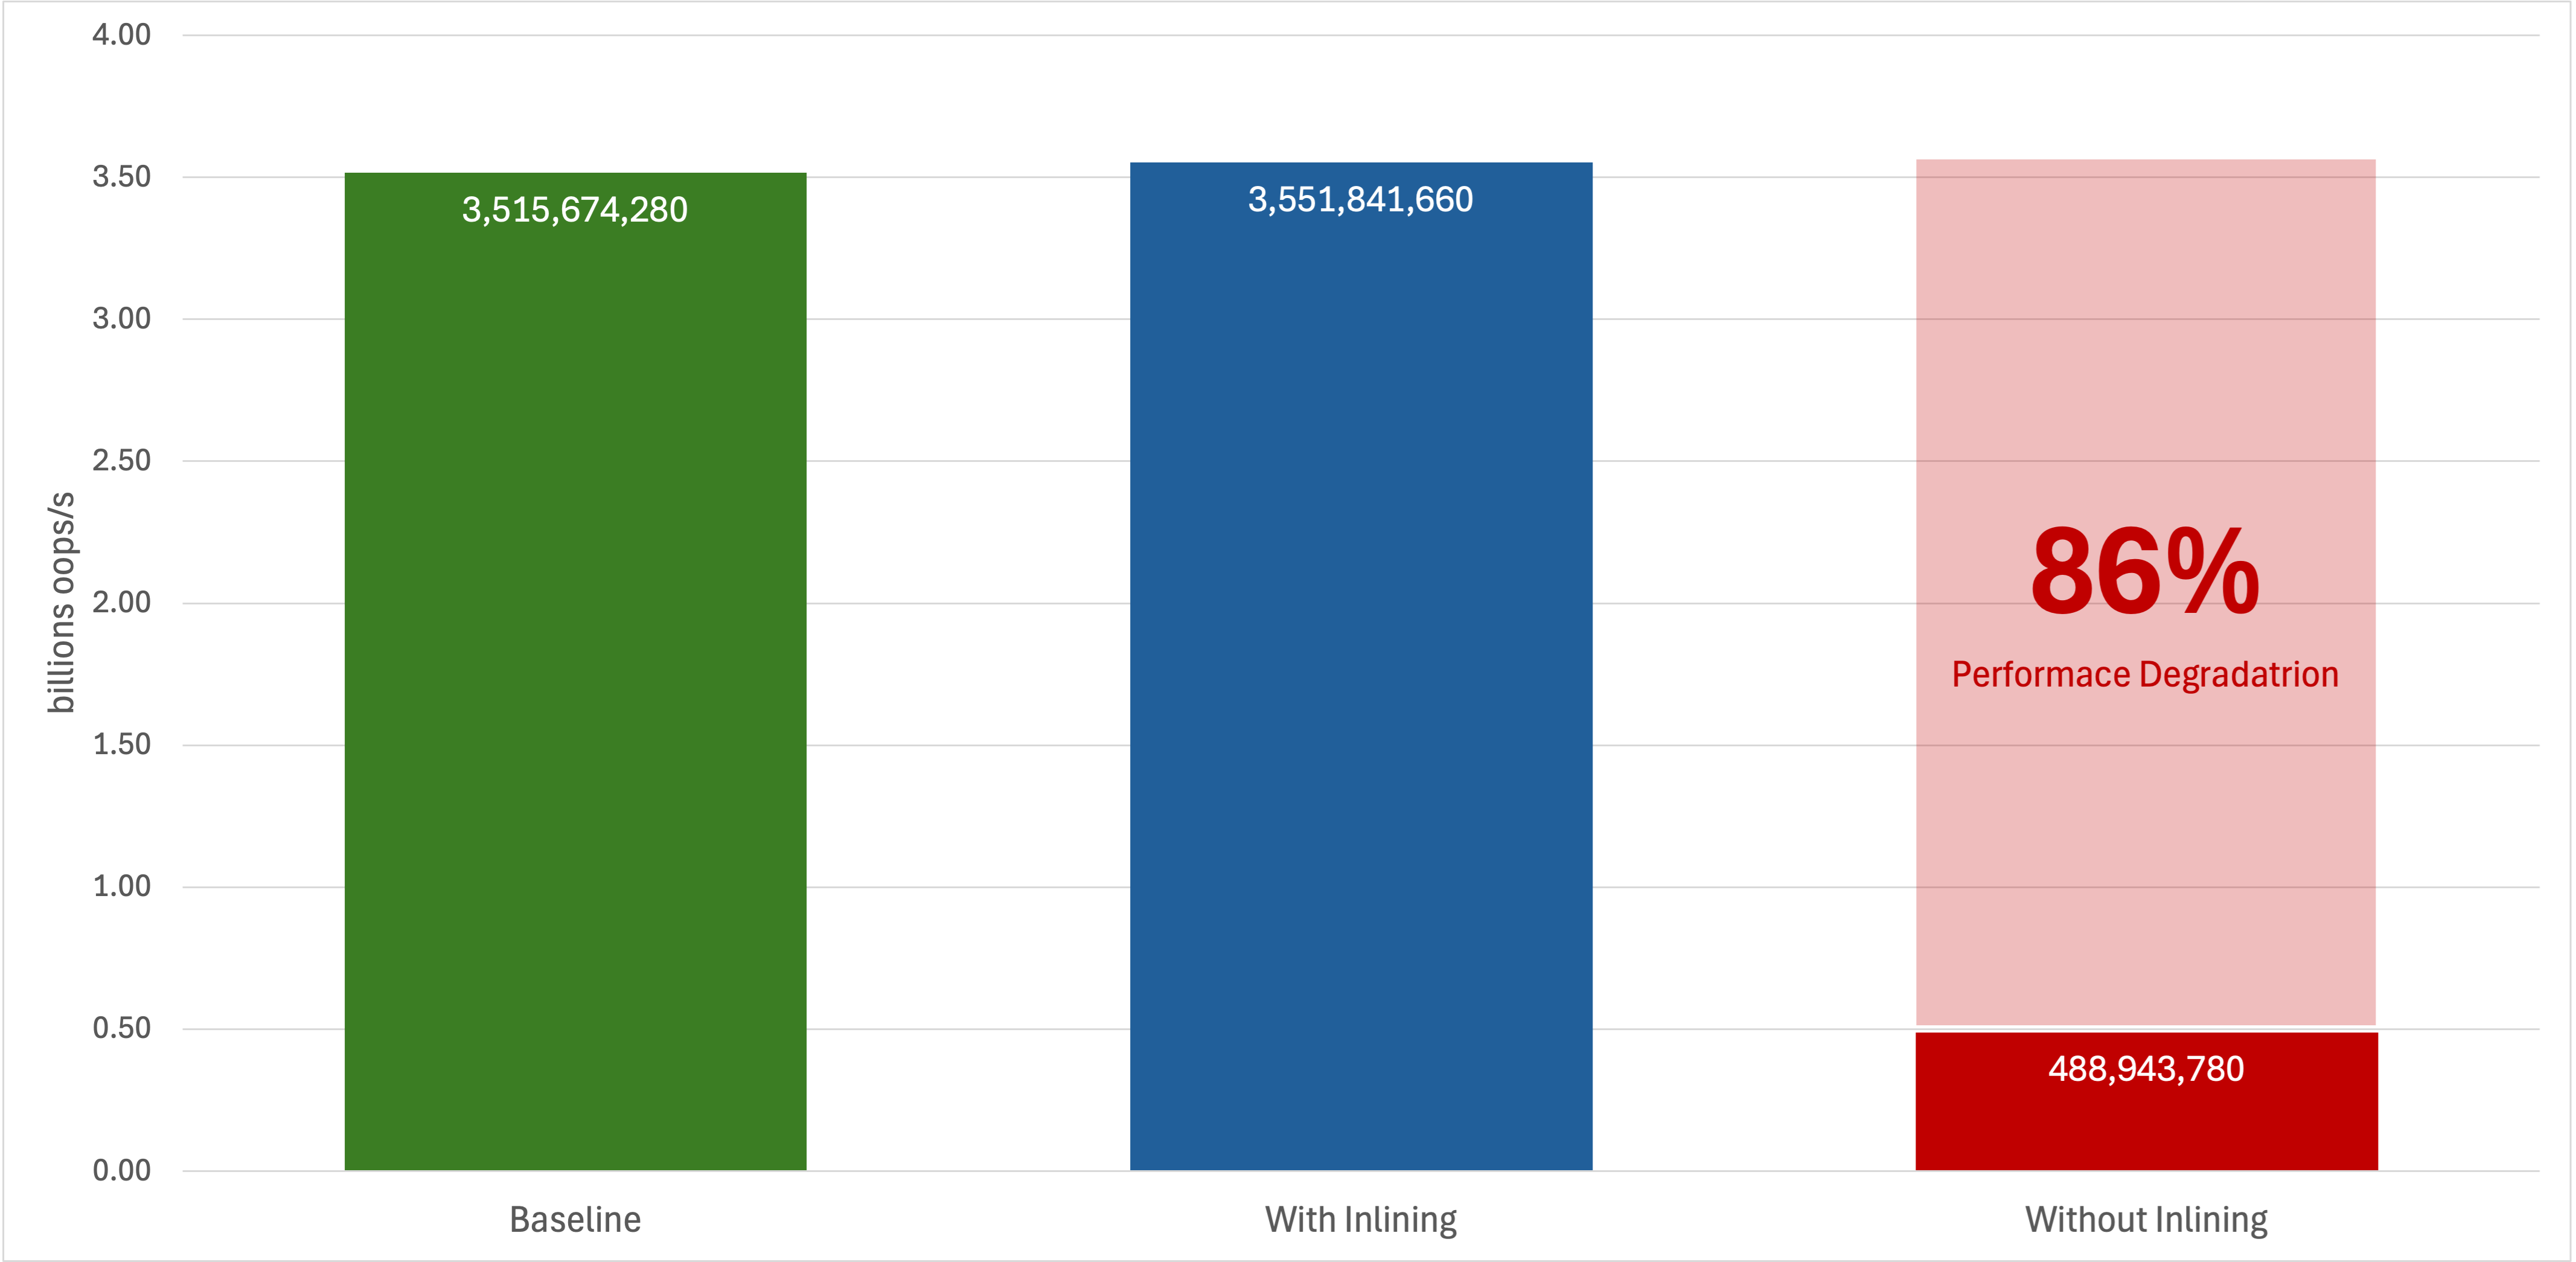
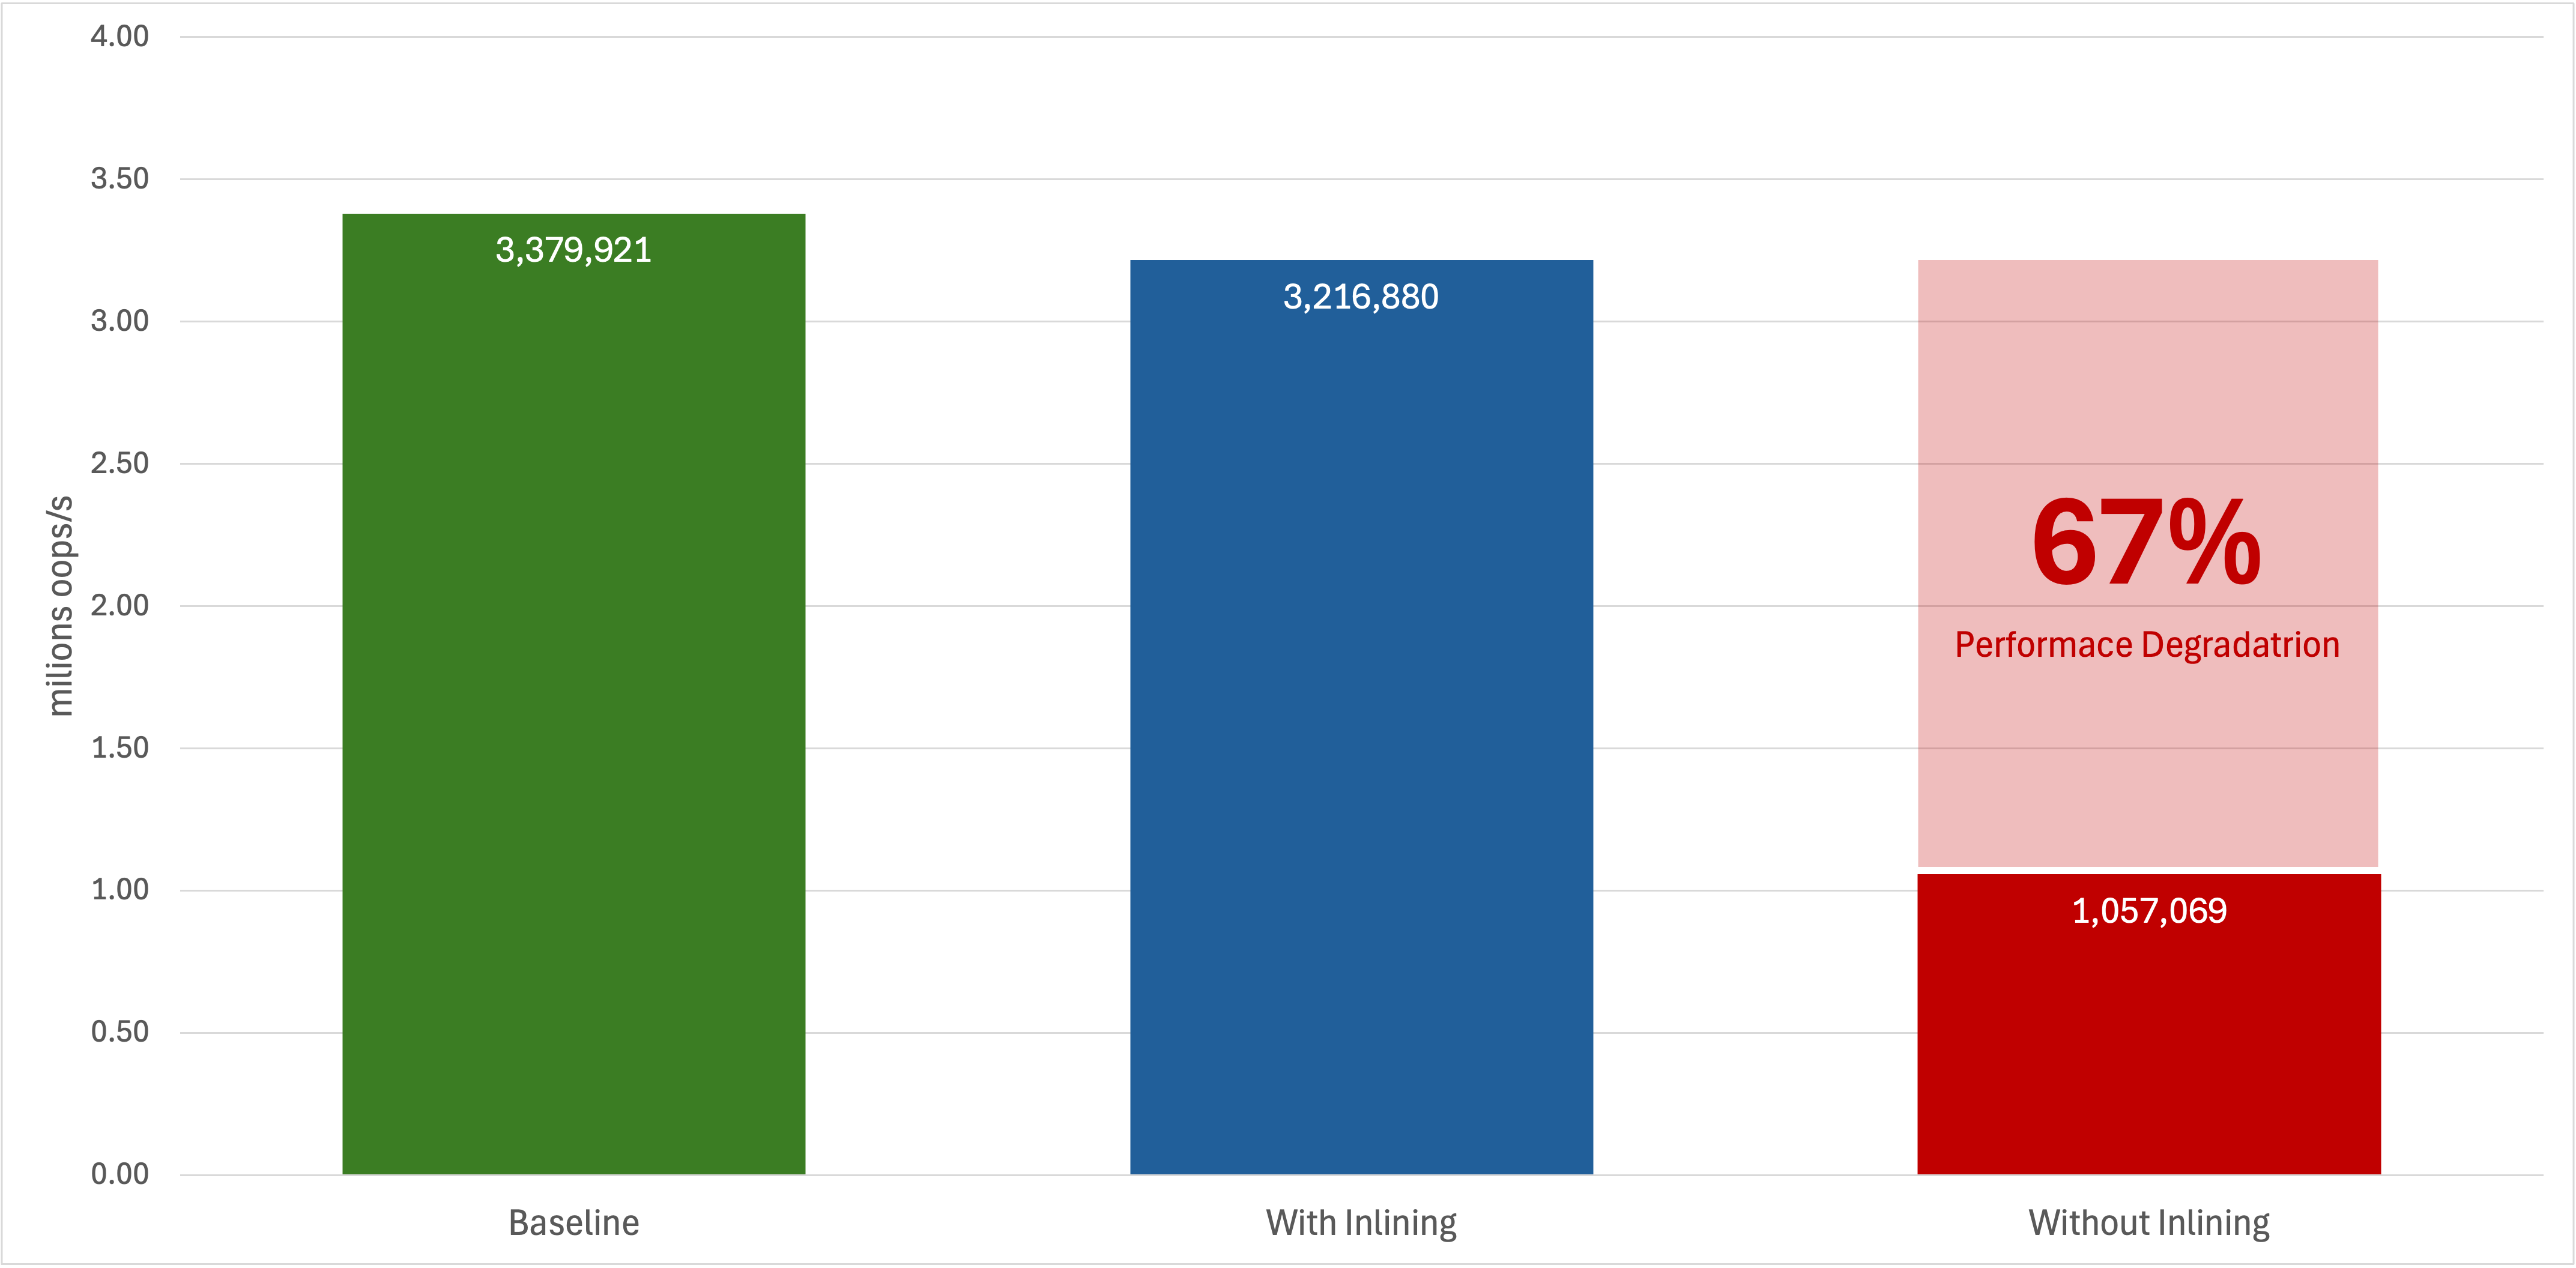
Running basic benchmarks on the simple inline example above produced the following results:
View used JMH Benchmark code
As it can be seen, the Baseline and the With inlining scenarios behave the same (taking into consideration also the statistical margin of error). On the other hand the Without inlining scenario shows a huge 86% performance degradation. As the code is very simple, extra optimizations are unlikely to happen or have a major impact. Thus, we can easily say that just inlining will bring a significant performance boost for a method call. I cannot stress enough that this is an improvement for a single method call. It does not mean that a REST CRUD call will be 80% faster because of a single inlined method.
Simple inlining details
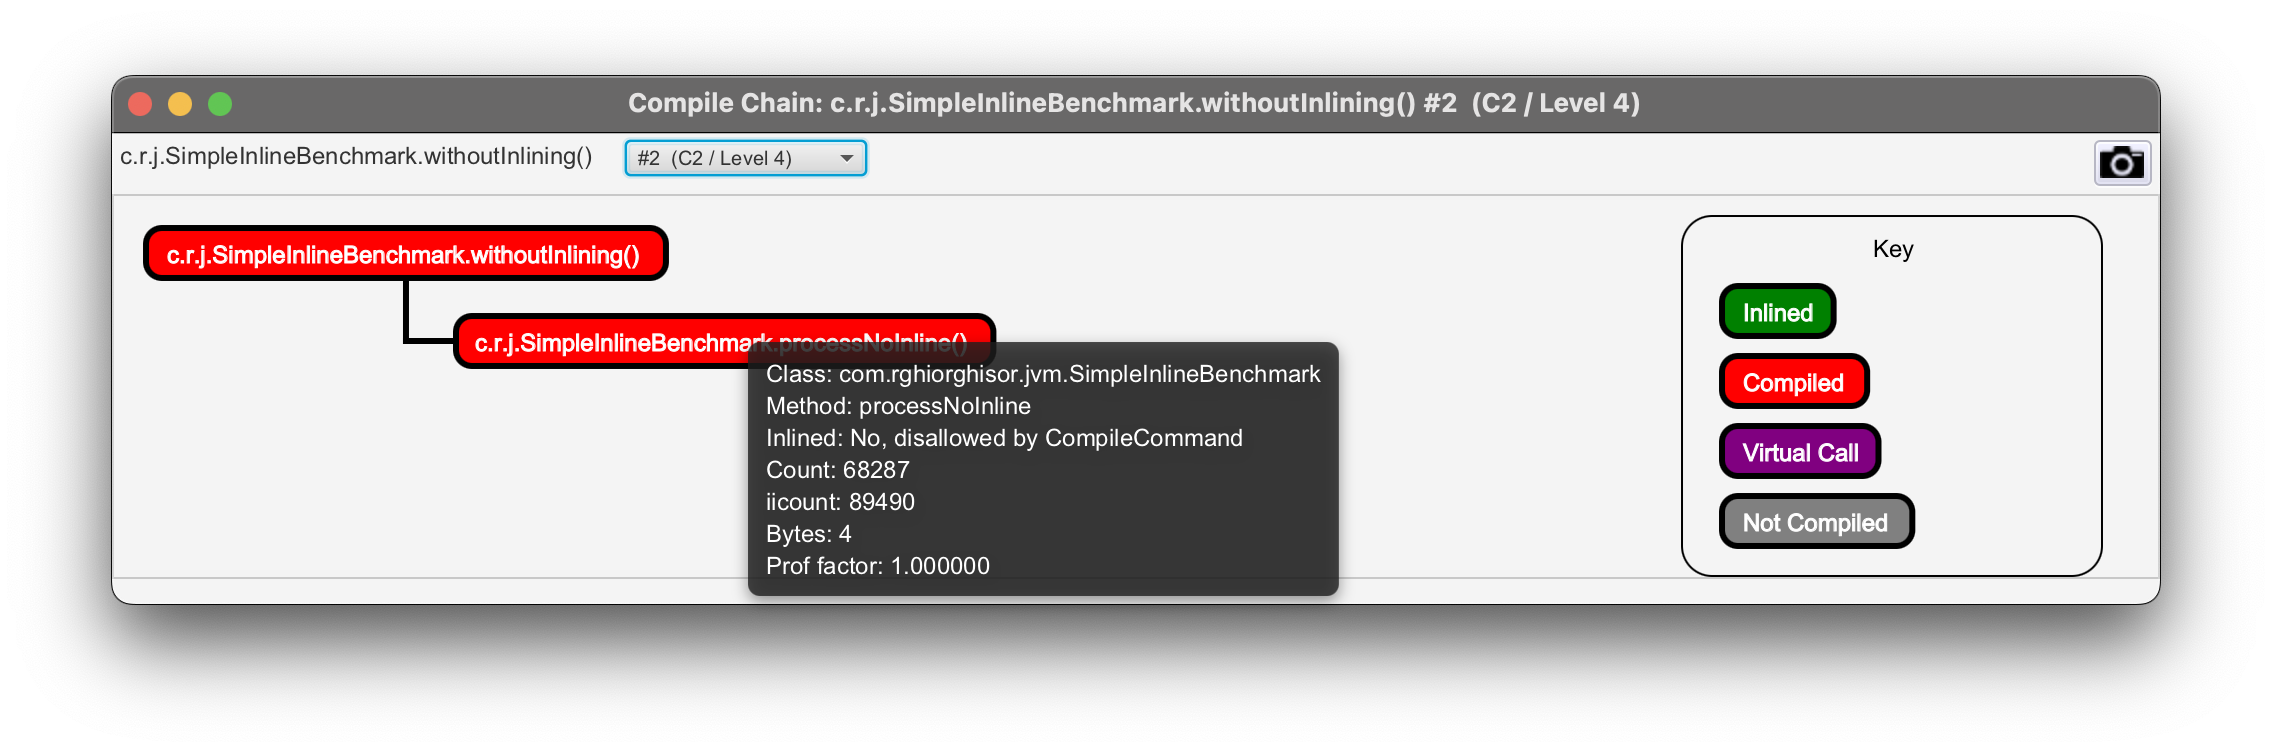
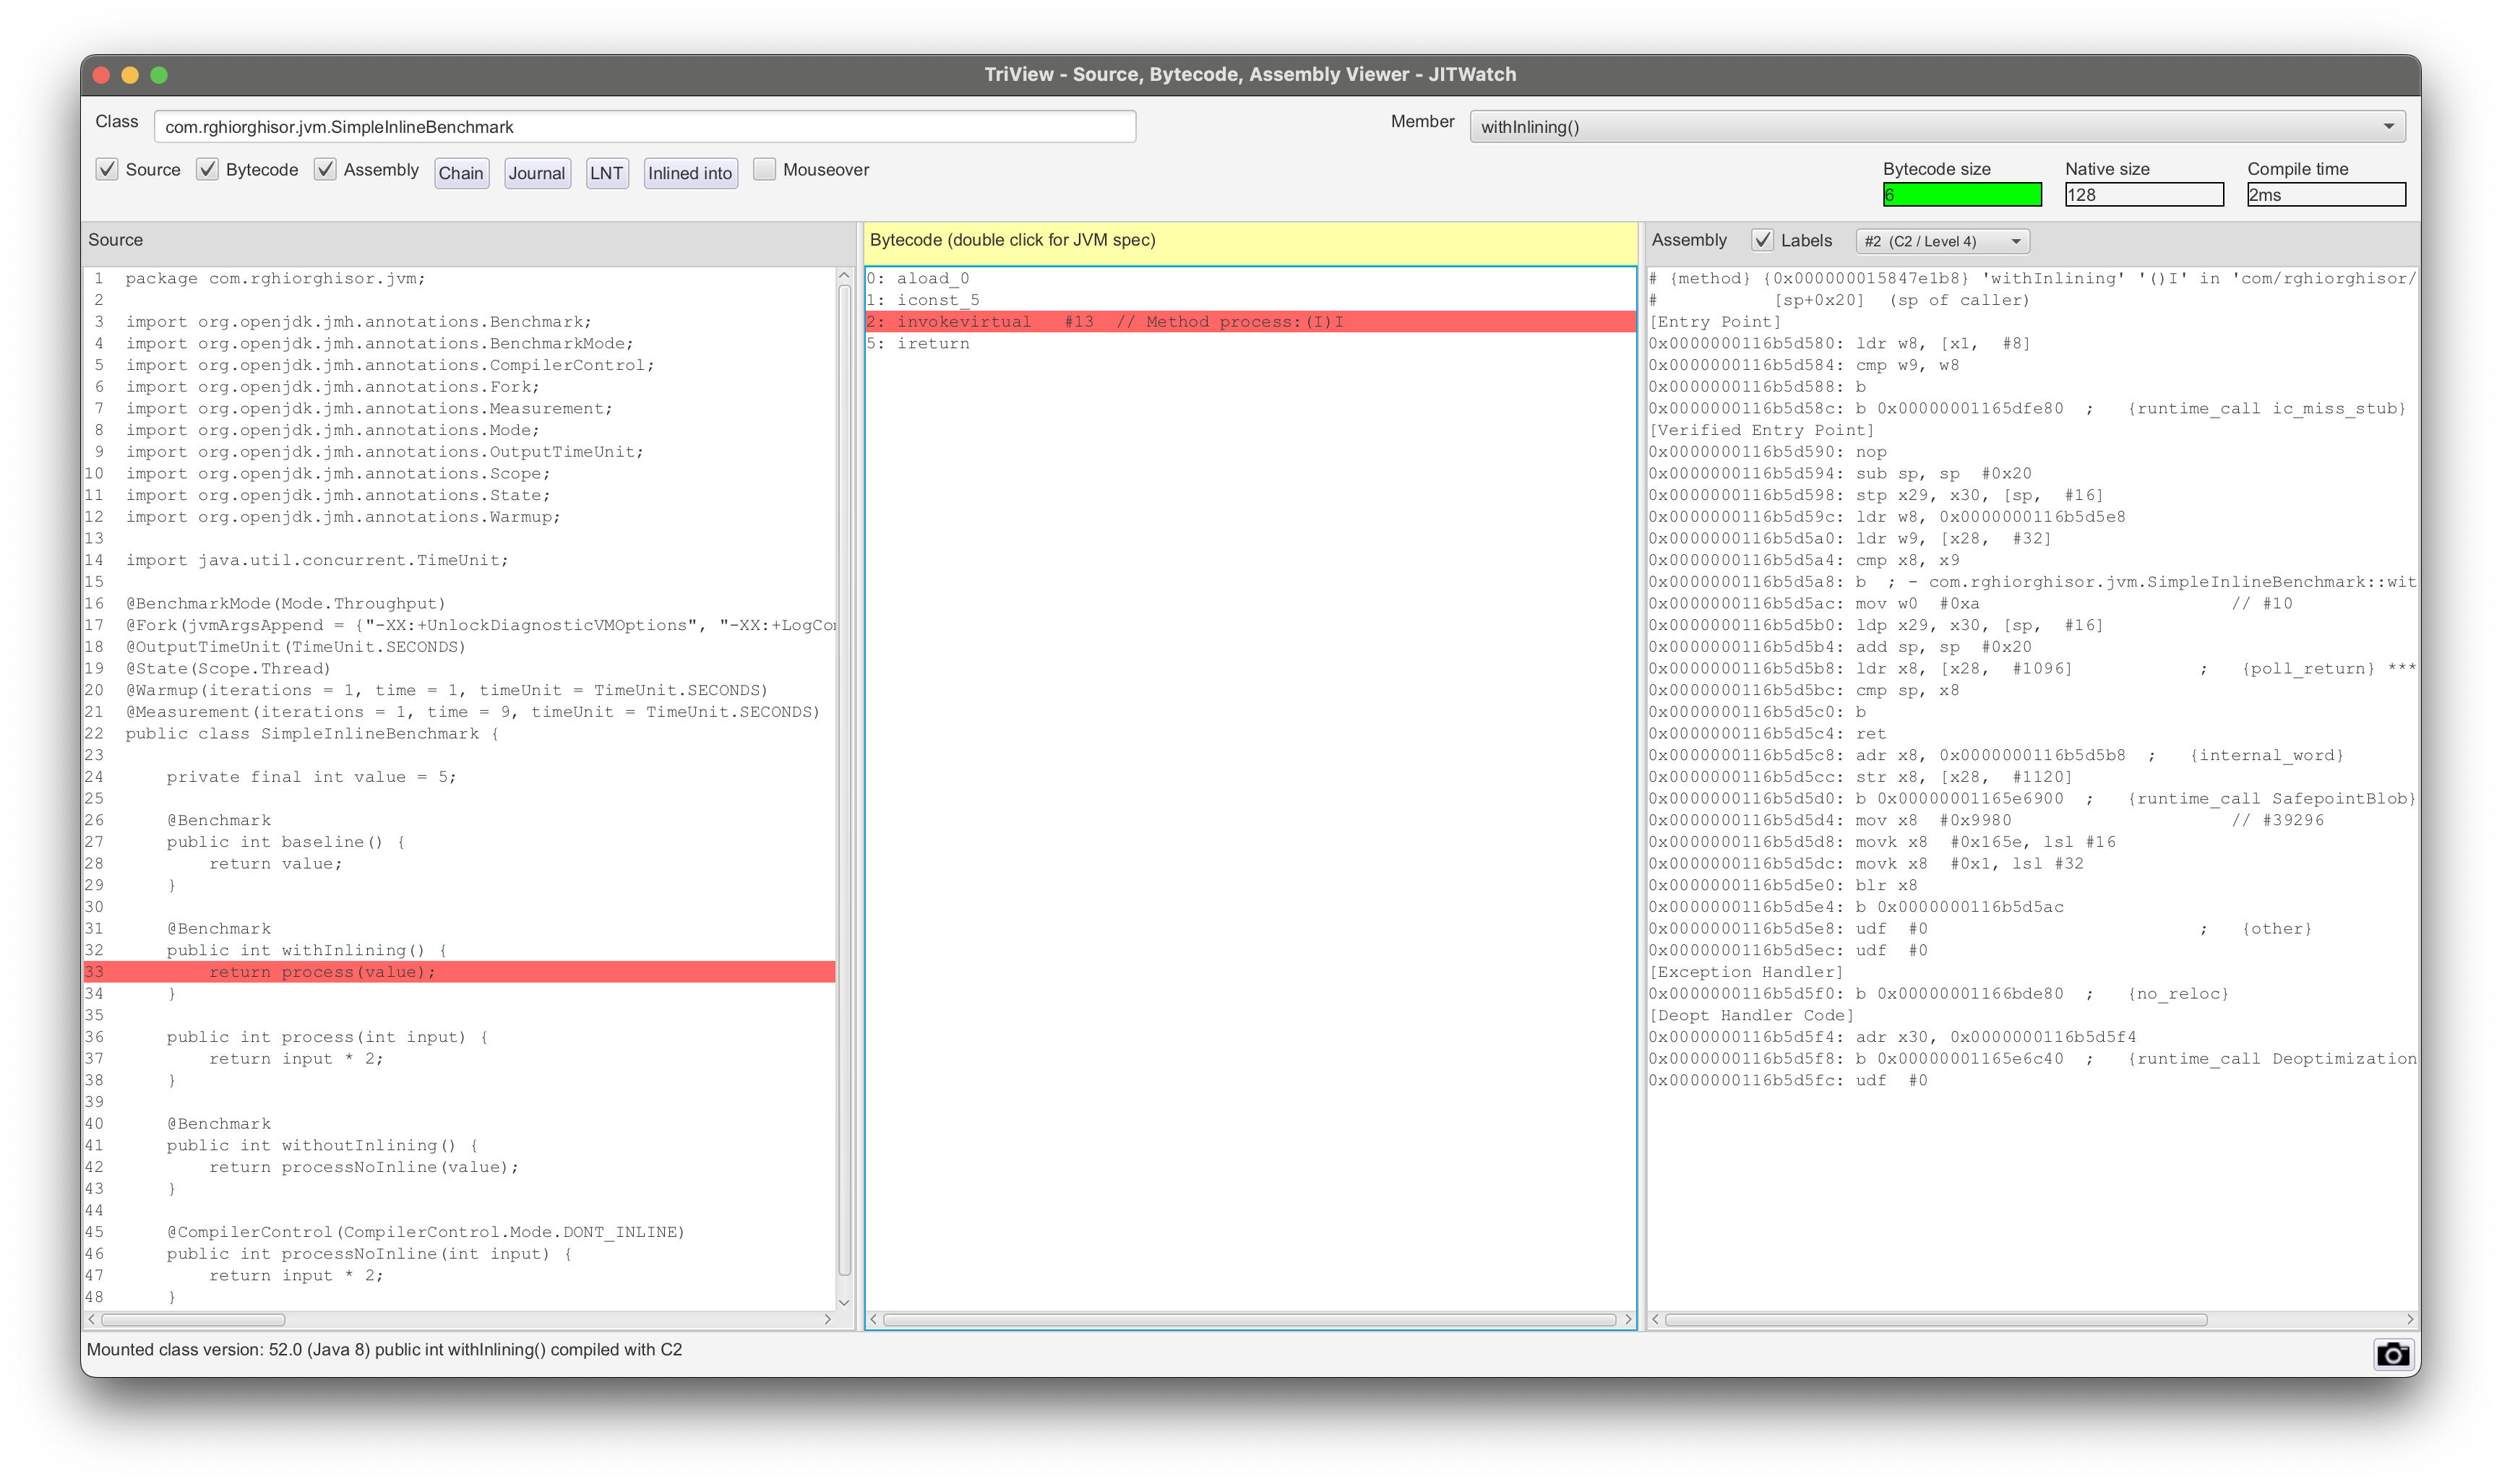
A quick JITWatch analysis of the withoutInlining() method confirms that inlining was not performed and provides the reasons why.
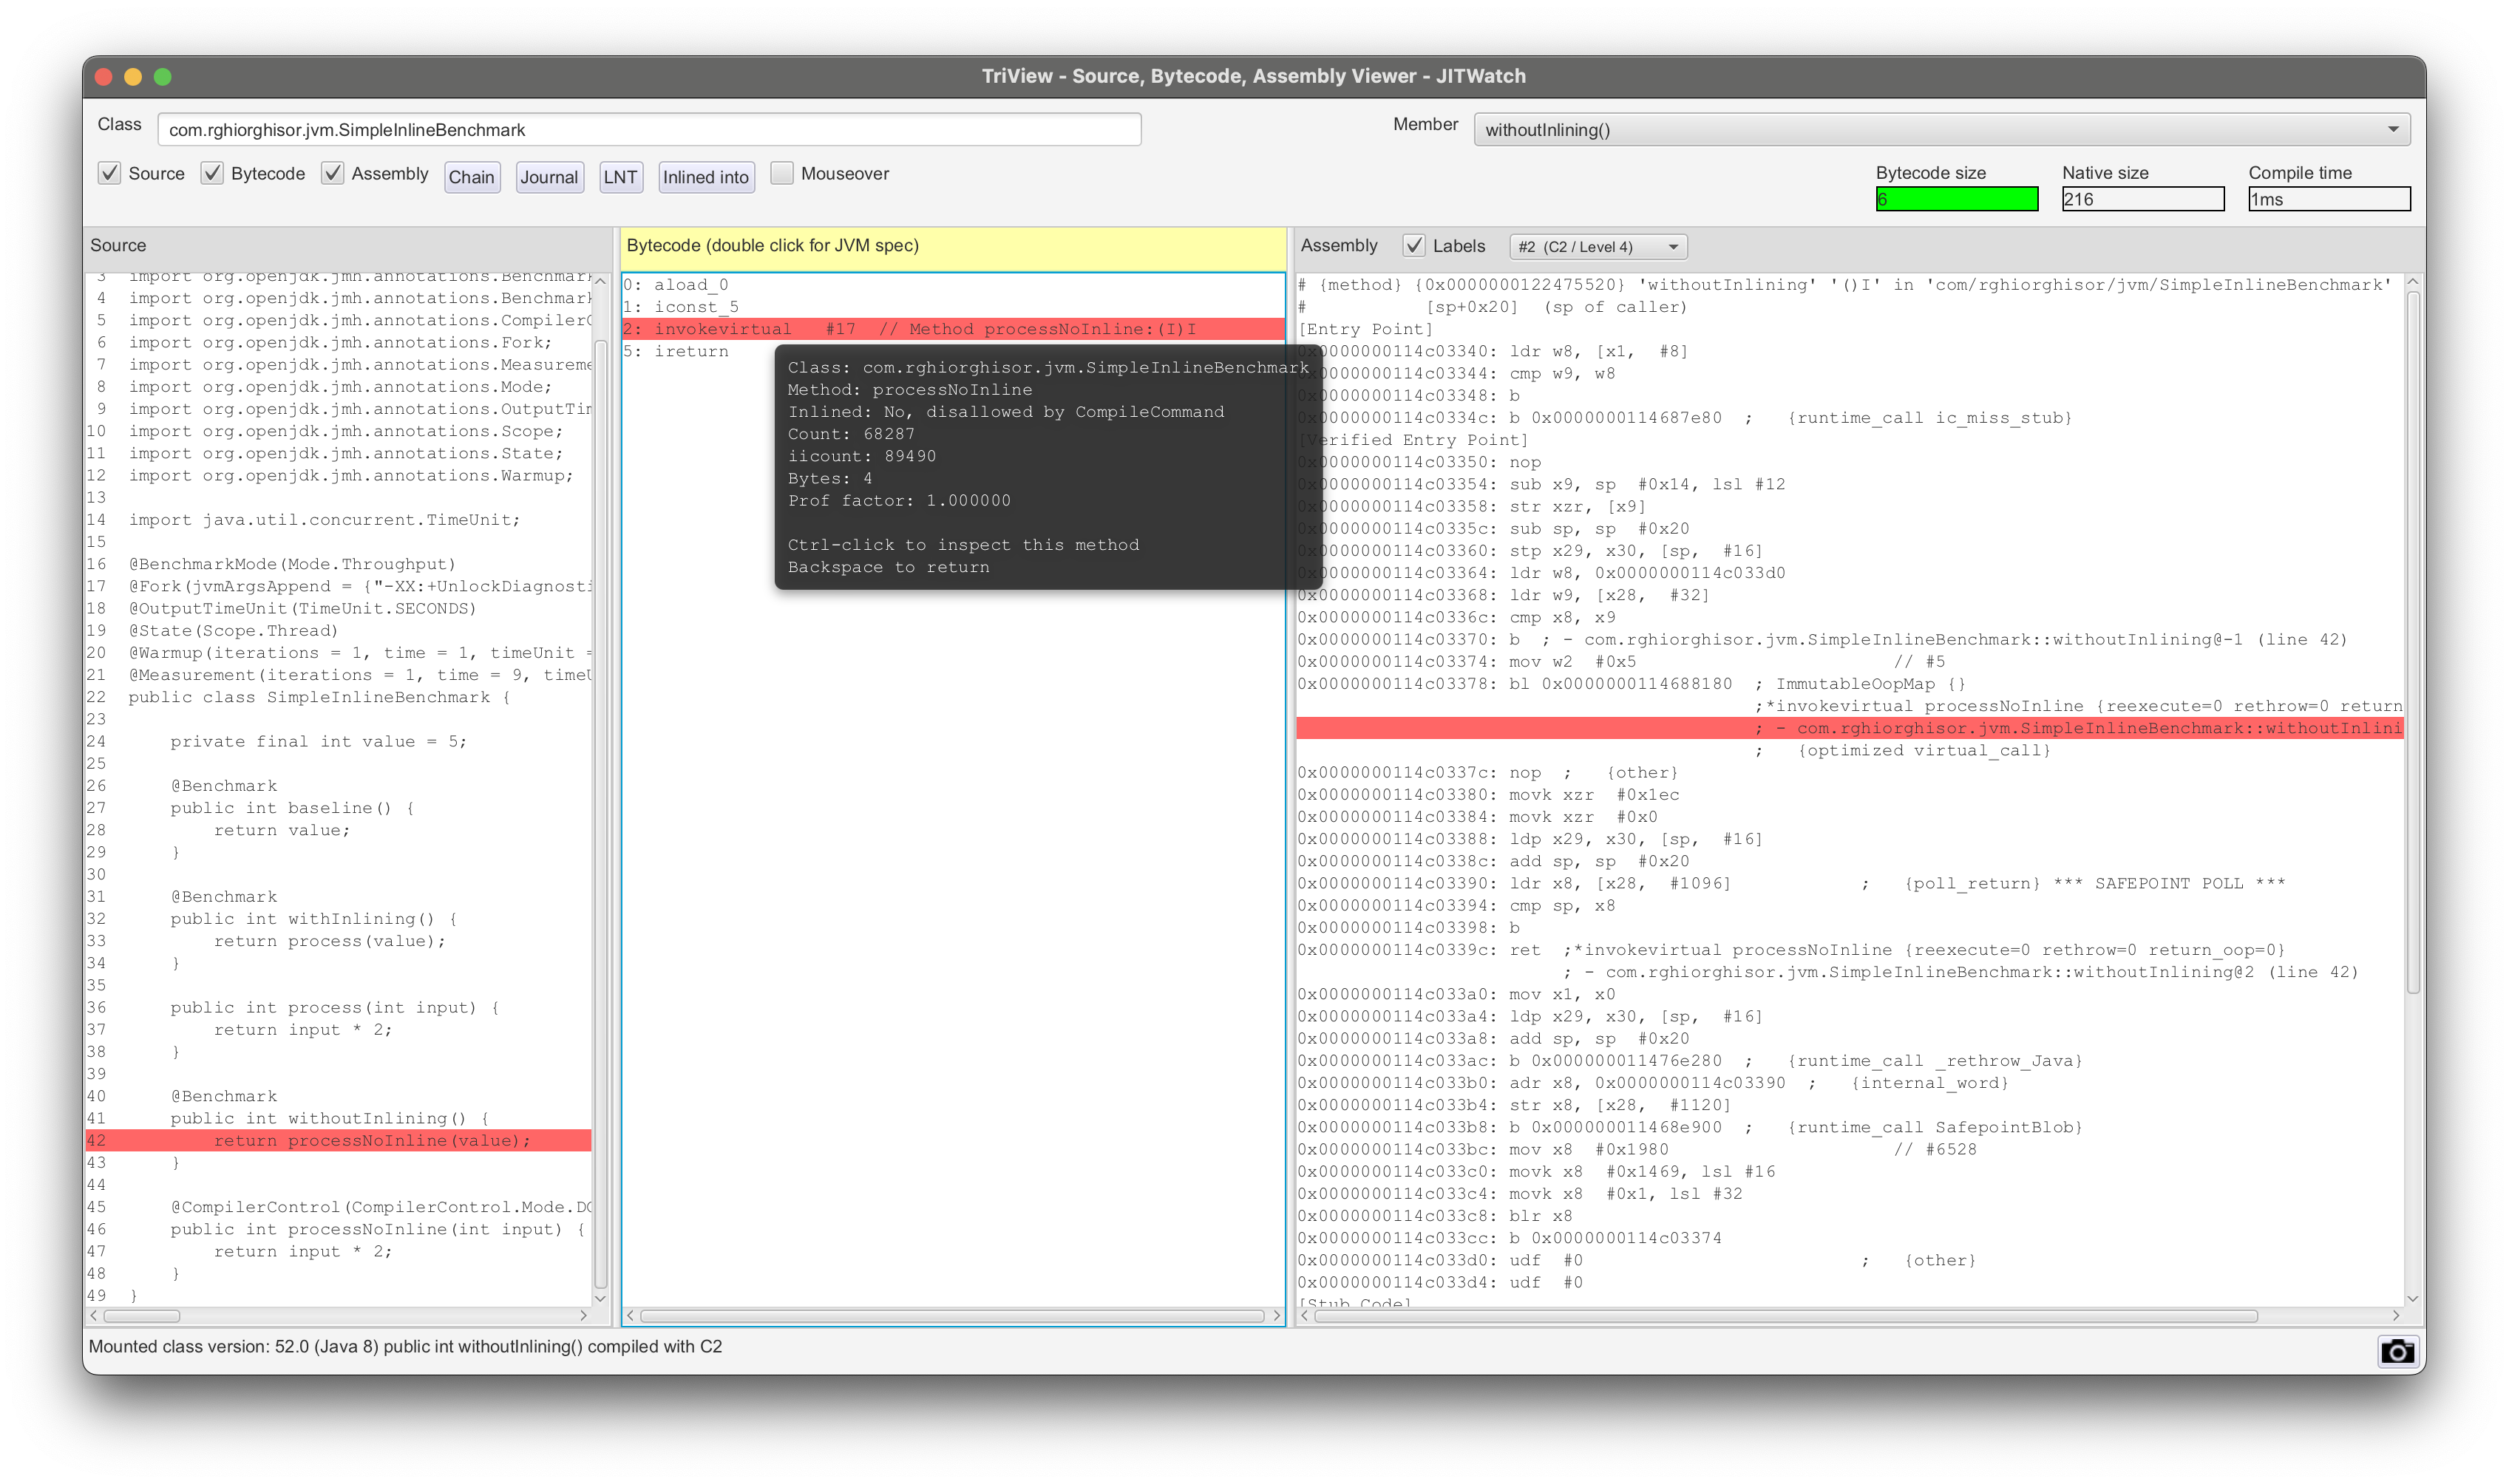
Additionally, for good measure I guess, we can check the JITWatch TriView section and observe that the call to processNoInline(int) is present in both the bytecode and the disassembly code.
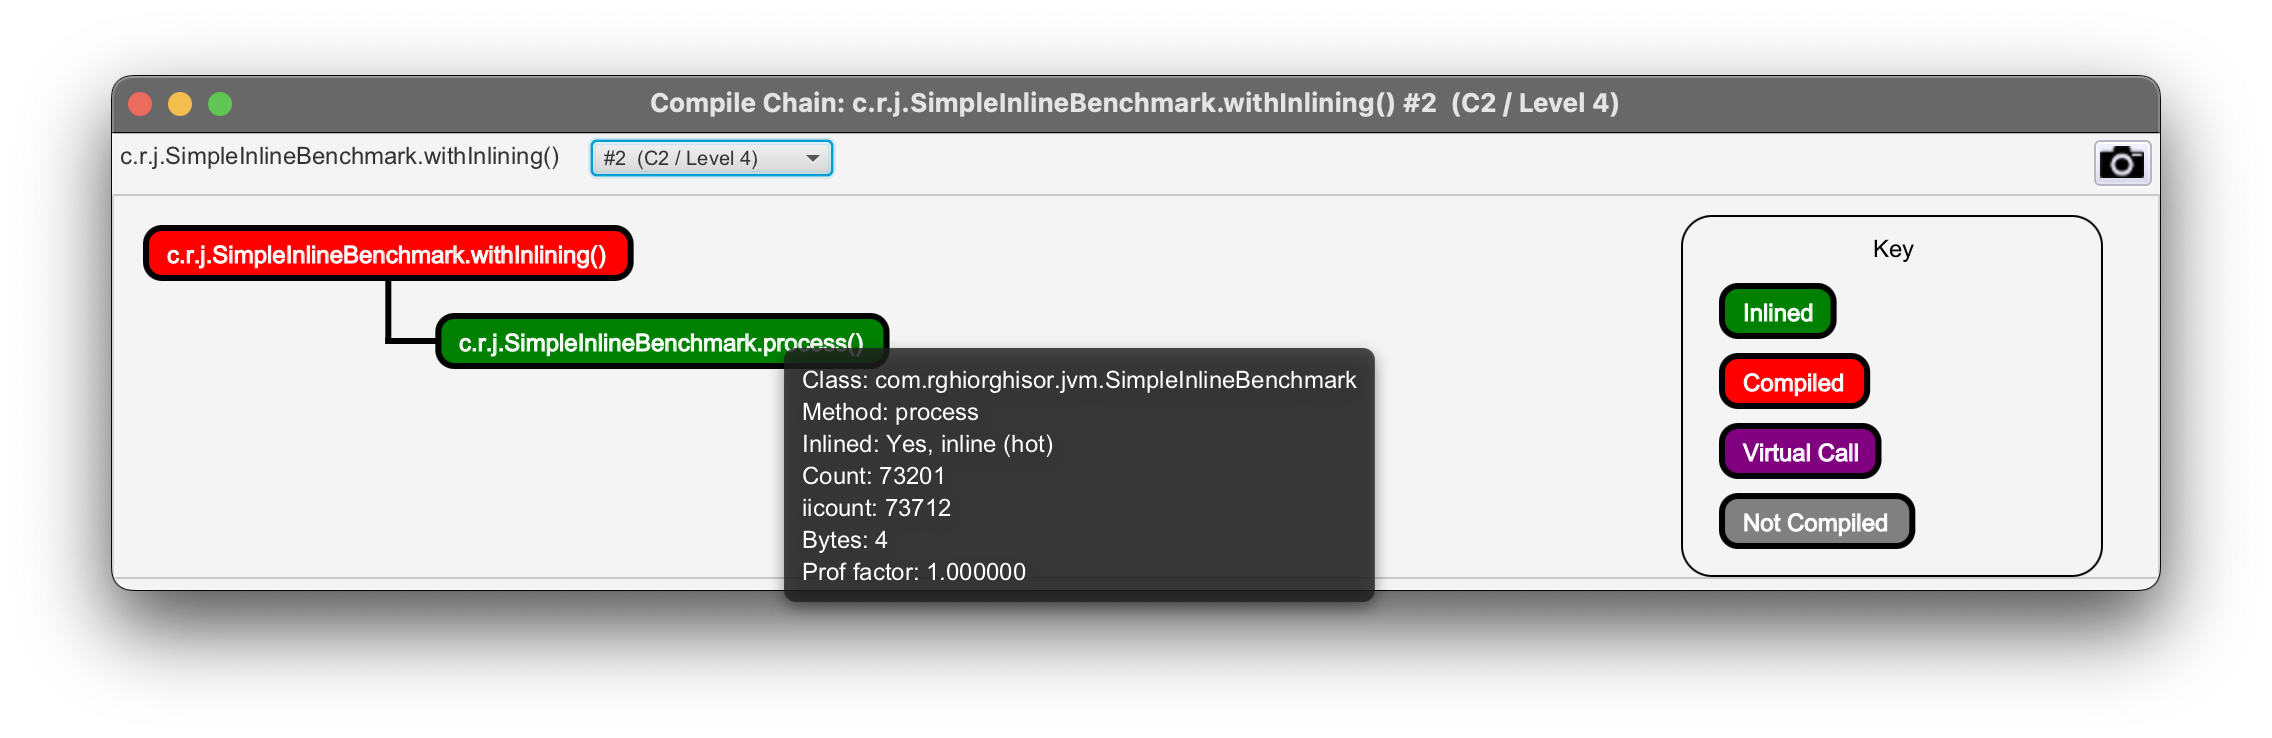
On the other hand, the withInlining() method is marked as inlined and its assembly output contains no calls to other methods.
Slightly complex inline
The above example depicts how inlining works but only serves as a simple example. Let’s take a look at a slightly more complex example involving a little more math.
Here the body of the fastCalculation(int) method will be copied to the fullCalculation() callee method. Running benchmarks on this will yield the following results:
View used JMH Benchmark code
Inlining depth
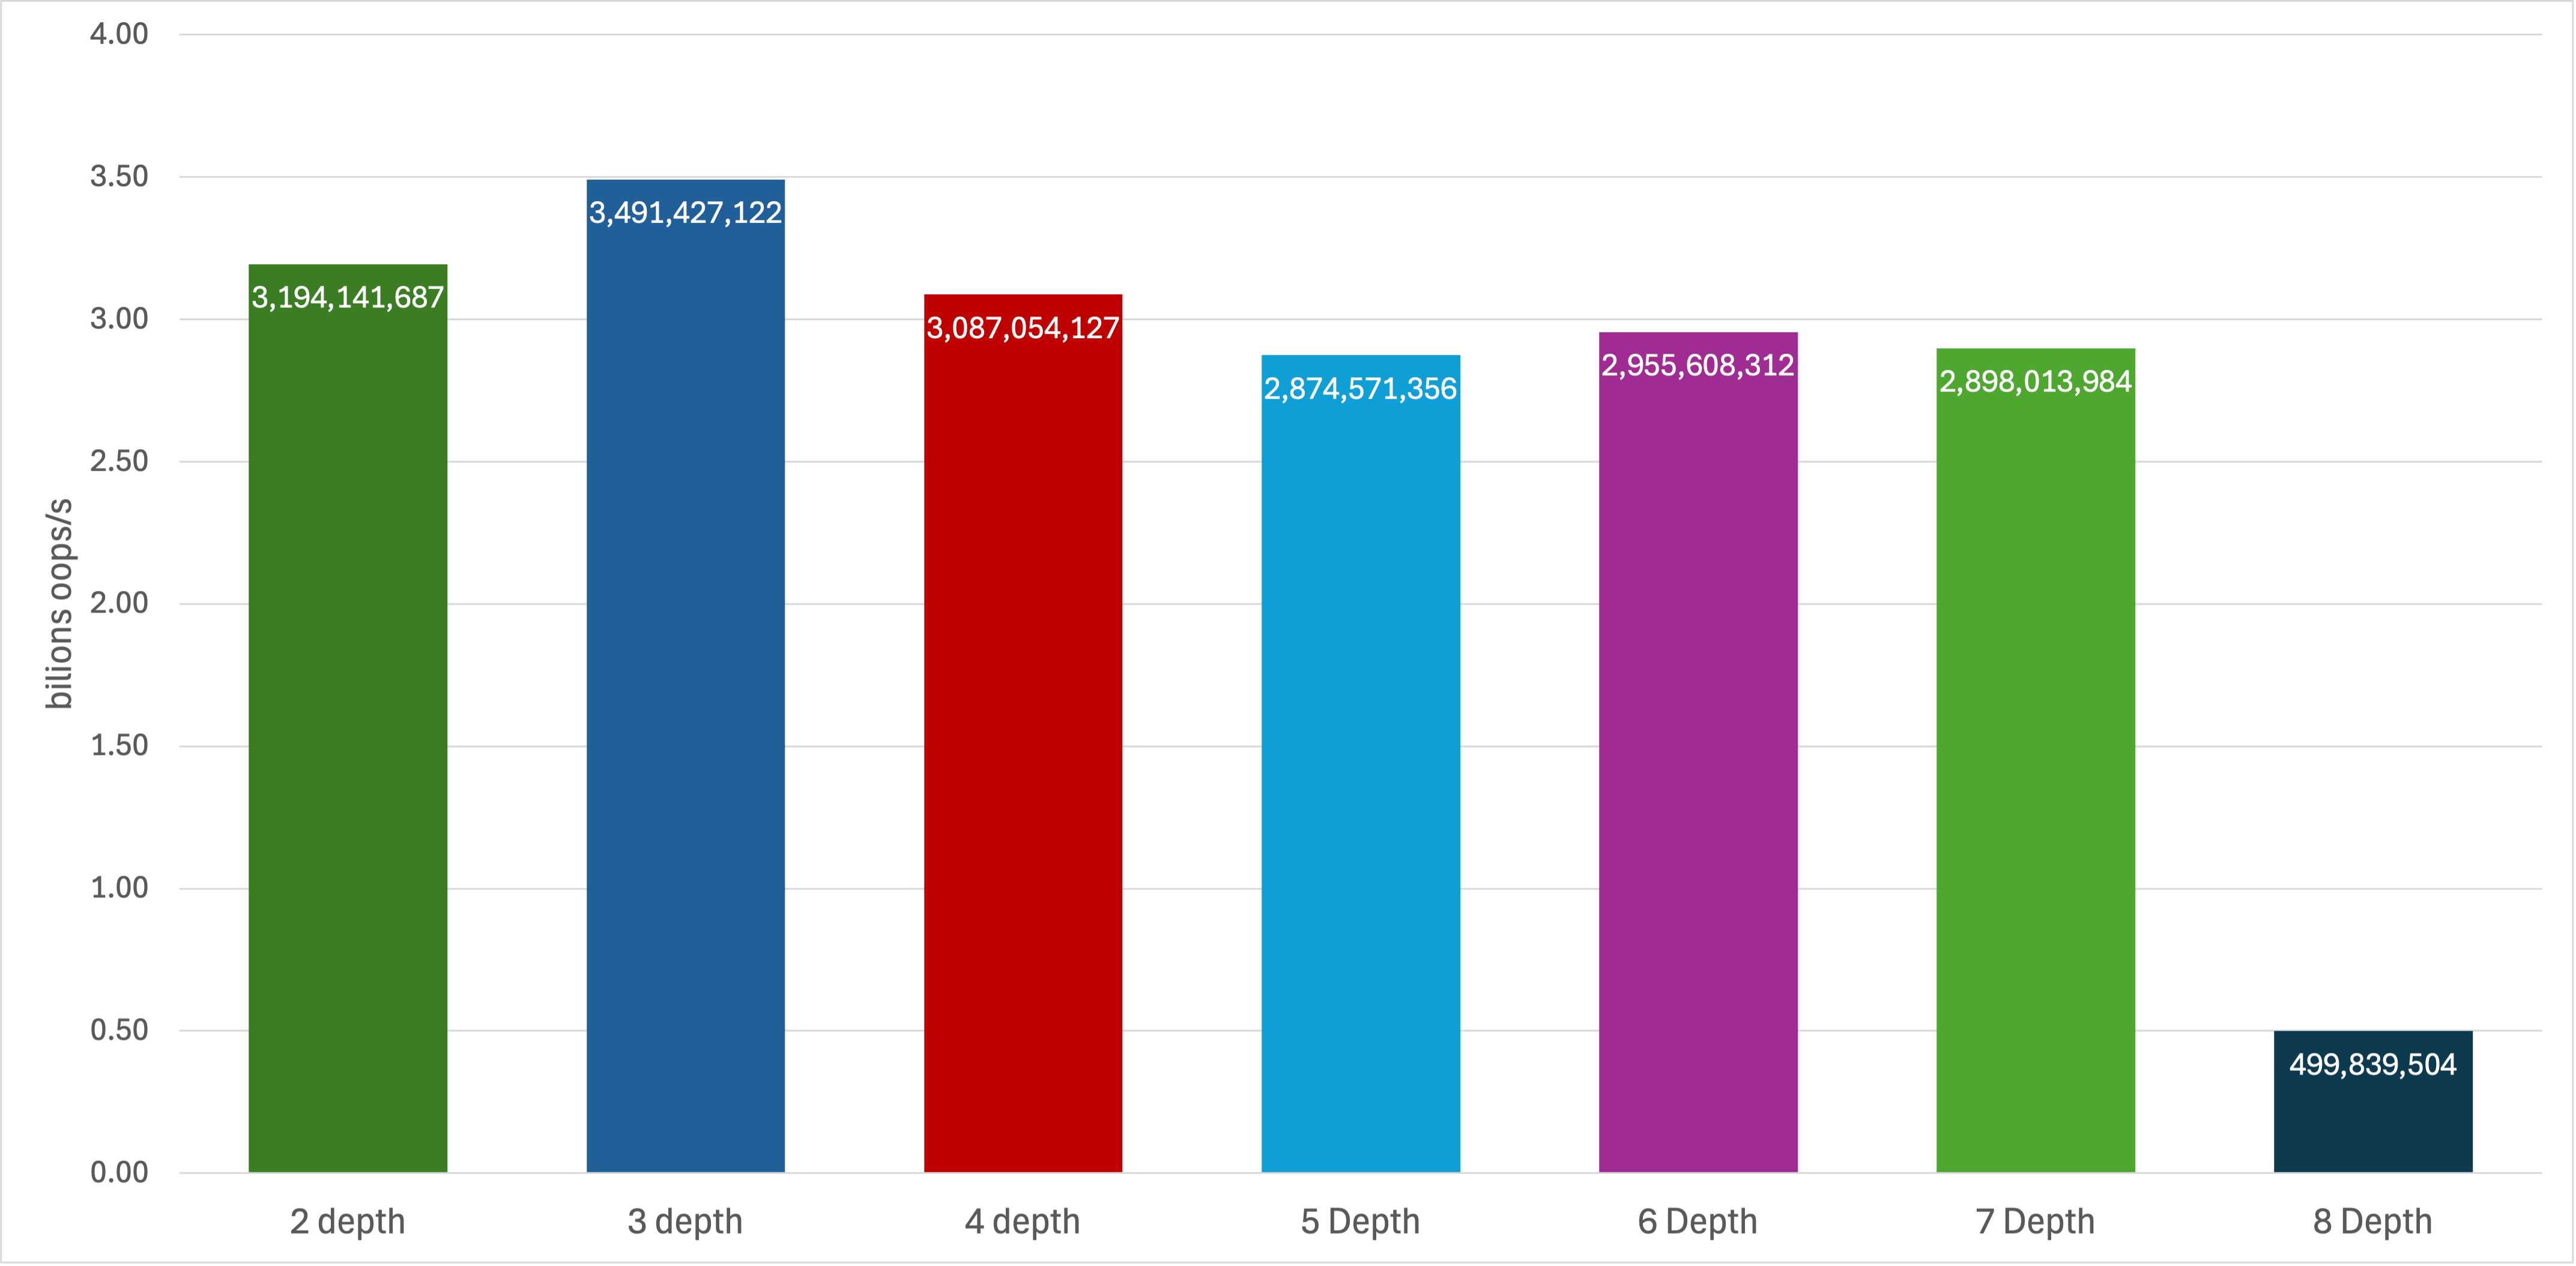
Inlining is recursive and compositional. If a method A inlines B, and B inlines C, JIT may form an inlining tree. However, this increases the method’s compilation budget and eventually hits thresholds, mainly -XX:MaxInlineLevel. By default, for Java 21, this flag is set to 15 for C2 and 9 for C1, and if exceeded, JIT stops inlining deeper calls to avoid excessive compile time and code size. Let’s see how inlining performs with different depths of method calls, between 7 and 2 (also setting -XX:MaxInlineLevel=7 for these benchmarks).
View used JMH Benchmark code
All in-depth calls perform effectively the same, whereas the absence of inlining results in an over 80% drop in operations per second.
Inlining and polymorphism
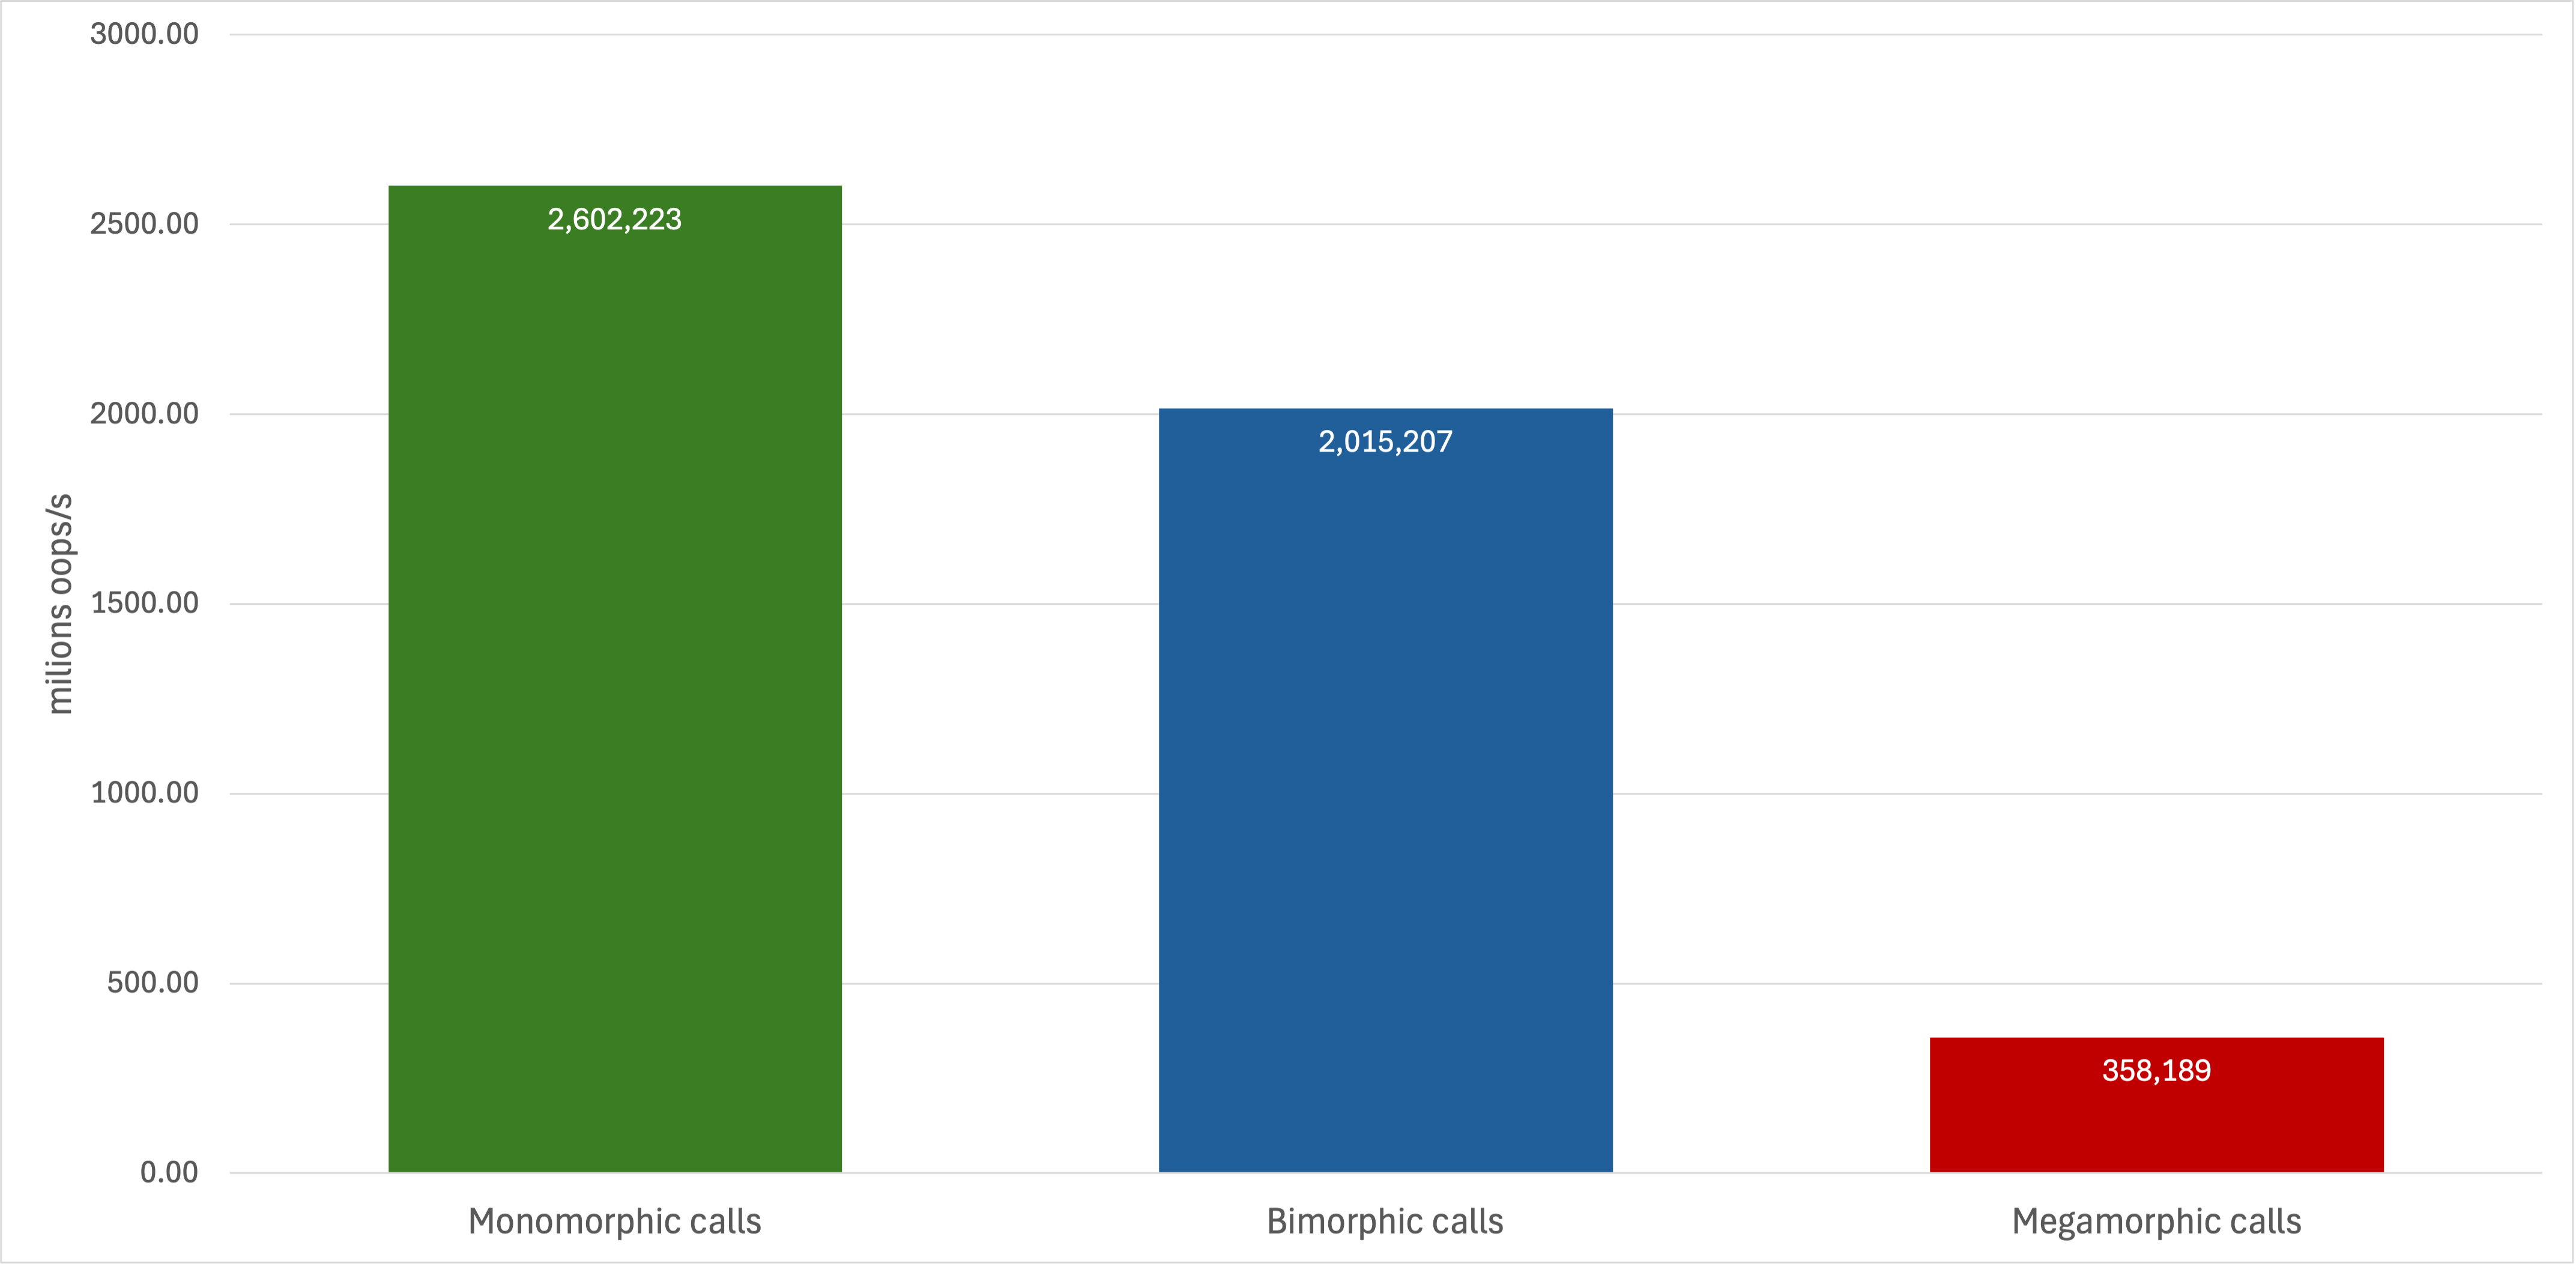
Inlining across dynamic calls, i.e. in a polymorphism context, is heavily influenced by call site profiling, a process where JIT collects runtime information about which classes are actually being invoked at a given call site. Based on this profile, JIT decides whether inlining is worthwhile and safe. These calls are typically categorized into three types:
Monomorphic calls: The call site can only see one single concrete class. This is the best case scenario for inlining because JIT can confidently replace the call with the method’s body, as it knows exactly which implementation will be executed. A simple example is that of a loop processing only
ArrayListinstances when callingsize(). Then every call goes to the sameArrayList.size()method.Bimorphic calls: The call site can see exactly two different classes at runtime. In this case, JIT may still inline both implementations, guarded by a quick type check to choose the right inlined body. An example of this would be a method that sometimes receives an
ArrayListand sometimes aLinkedList, callingsize()on both. The JIT might inline both, adding a conditional to pick the right one.Megamorphic calls: The call site can see many different classes. This creates too much complexity for guarded inlining, so the JVM typically avoids inlining here, relying on a standard virtual call instead. Example: A generic
List<?>processor that works with a wide variety of list implementations in the same method, such asArrayList,LinkedList,CopyOnWriteArrayListand maybe additional custom types.
Note: The above example is used only for explanation purposes. In real world, the size() method is considered trivial and often already intrinsec rather than inlined.
Running a set of benchmark tests for such cases reveals that megamorphic calls is underperforming a lot in comparison to the others.
View used JMH Benchmark code
Inlining trade-offs
As seen above, inlining may bring considerable performance improvements but one must take into consideration that it is not universally beneficial. JIT compiler weighs eventual gains against downsides before deciding to inline:
Code size growth (code bloat): Each inlined method expands the caller’s bytecode into more machine code. Excessive inlining can increase the compiled method’s size to the point where it no longer fits well in the CPU’s instruction cache (i-cache), potentially slowing down execution;
Longer compilation time Inlining deeply nested or large methods increases JIT compile time. This is especially important during warm-up phases where compilation pauses can cause startup latency;
Reduced flexibility for deoptimization Once methods are inlined, undoing that decision (e.g., if profiling shows changed call patterns) requires deoptimization and recompilation, which can briefly stall execution;
Diminishing returns Inlining the obvious hot small methods is highly beneficial. Beyond that, inlining increasingly larger methods or rare call sites often brings negligible gains;
These are the reasons why JIT puts in place settings and checks in order to limit inlining. Please consider them when making JIT inlining tuning, otherwise you may find that performance is highly affected.
Inlining limits
There are, as we saw above, several cases where JIT either refuses to inline a method or where inlining provides no tangible benefits. Being aware of these limits prevents wasting effort on optimizations the JVM cannot perform.
1. Method size thresholds
JIT uses some thresholds to decide whether to perform the inline optimizations. Some of them are:
-XX:MaxInlineSize: [C2 compiler] The maximum bytecode size (in bytes) of a cold callee. By default, the maximum bytecode size is set to 35 bytes;-XX:C1MaxInlineSize: [C1 compiler] Same as above but for the C1 compiler.-XX:FreqInlineSize: [C2 compiler] The maximum bytecode size (in bytes of) a hot callee. The default value depends on the platform, but usually is set to 325 bytes.-XX:InlineSmallCode: [C2 compiler] The maximum code size (in bytes) for already compiled methods that may be inlined. Basically, inline the callee if it has a compiled code size less than this value. The default value depends on the platform, but usually is set to 2500 bytes.
2. Deep call chains
JIT limits the number of nested calls it will inline via (but not limited to):
-XX:MaxInlineLevel: [C2 compiler] Maximum number of nested calls that are inlined. The default is set to 15;-XX:C1MaxInlineLevel: [C1 compiler] Same as above but for the C1 compiler. The default value is set to 9.
If the call stack exceeds this depth, the remaining calls won’t be inlined.
3. Technical constraints
In some cases, inlining is not performed at all. Here are some cases:
Native methods: Native (JNI) methods will not be inlined because their bodies exist outside the JVM’s managed bytecode environment.
Synchronized methods with high contention: Even if small synchronized methods can be inlined, if lock contention is high, JIT may skip inlining to avoid inlining unnecessary monitor enter/exit code.
Methods using unsupported bytecodes: Certain bytecodes like
jsrandretcomplicate analysis and prevent inlining. Although these are rare in newer Java code, their presence disallows inlining.Methods with complex exception handling: Methods with complicated
try-catch-finallyblocks or unusual control flow structures might be skipped by the inliner due to difficulty in correctly preserving semantics during inlining.Native or reflective calls inside methods: If a method internally performs reflective calls or other dynamic operations that prevent static analysis, the JIT may refuse to inline it.
How to observe JIT inlining
Probably AI can give you a way more detailed step by step tutorial on how to observe your JIT inline process. Here I am just going to list the basics and some of the tools I have used just to give you a head start:
Add JVM args to your Java application. Some of the ones I used for benchmarking are:
-XX:+UnlockDiagnosticVMOptions,-XX:+LogCompilation,-XX:LogFile=hotspot-_%p.log,-XX:+PrintCompilation,-XX:+PrintInlining,-XX:+PrintAssembly;Use JITWatch to analyse the output
hotspot-_%p.logfile(s);Use JMH for benchmarking. Refer to my benchmarks repo for examples.
How inlining affects our code
As we already saw, inlining is a low-level JIT optimization, but it can lead to effects on the performance of everyday application code. Even though we as developers don’t think about it while writing business logic, the way we structure code can influence whether the JIT decides to inline a method, thus directly affecting execution speed.
To explore this, let’s look at a practical example. In many systems, we need to process a series of objects of different types that extend a base one. We will be using the events analogies below.
Therefore imagine a system that processes a continuous stream of events, each belonging to a specific type such as USER_EVENT, SYSTEM_EVENT or ADMIN_EVENT. All event types share a common base class, but each requires its own handling logic.
Each event type requires specific handling logic, often implemented in its own processor class. The design challenge is to route each event to its corresponding processor efficiently while keeping the code maintainable and extensible.
A common design pattern for this problem is the Chain of Responsibility.
In our code, EventsProcessor maintains a Map<EventType, EventProcessor> while the process(Event) method looks up the correct processor at runtime and calls it:
- Retrieve the correct
EventProcessorimplementation from the map. - Call
processor.process(event)to handle the event.
Often, I find myself using this approach. It is extensible as adding a new event type is as simple as adding a new processor to the map. It also keeps the dispatch logic out of the main processing loop for cleanliness.
In this chain of responsibility setup, processor.process(event) is an interface call. Over time, if different processor types are used, JIT treats it as a megamorphic call site, limiting or completely blocking inlining.
A different solution
An alternative is to replace the indirection with a switch statement over the event type, as shown in EventsProcessorWithSwitch.
In this approach:
- Each case directly calls the relevant processor.
- The call sites are monomorphic and statically known at compile time.
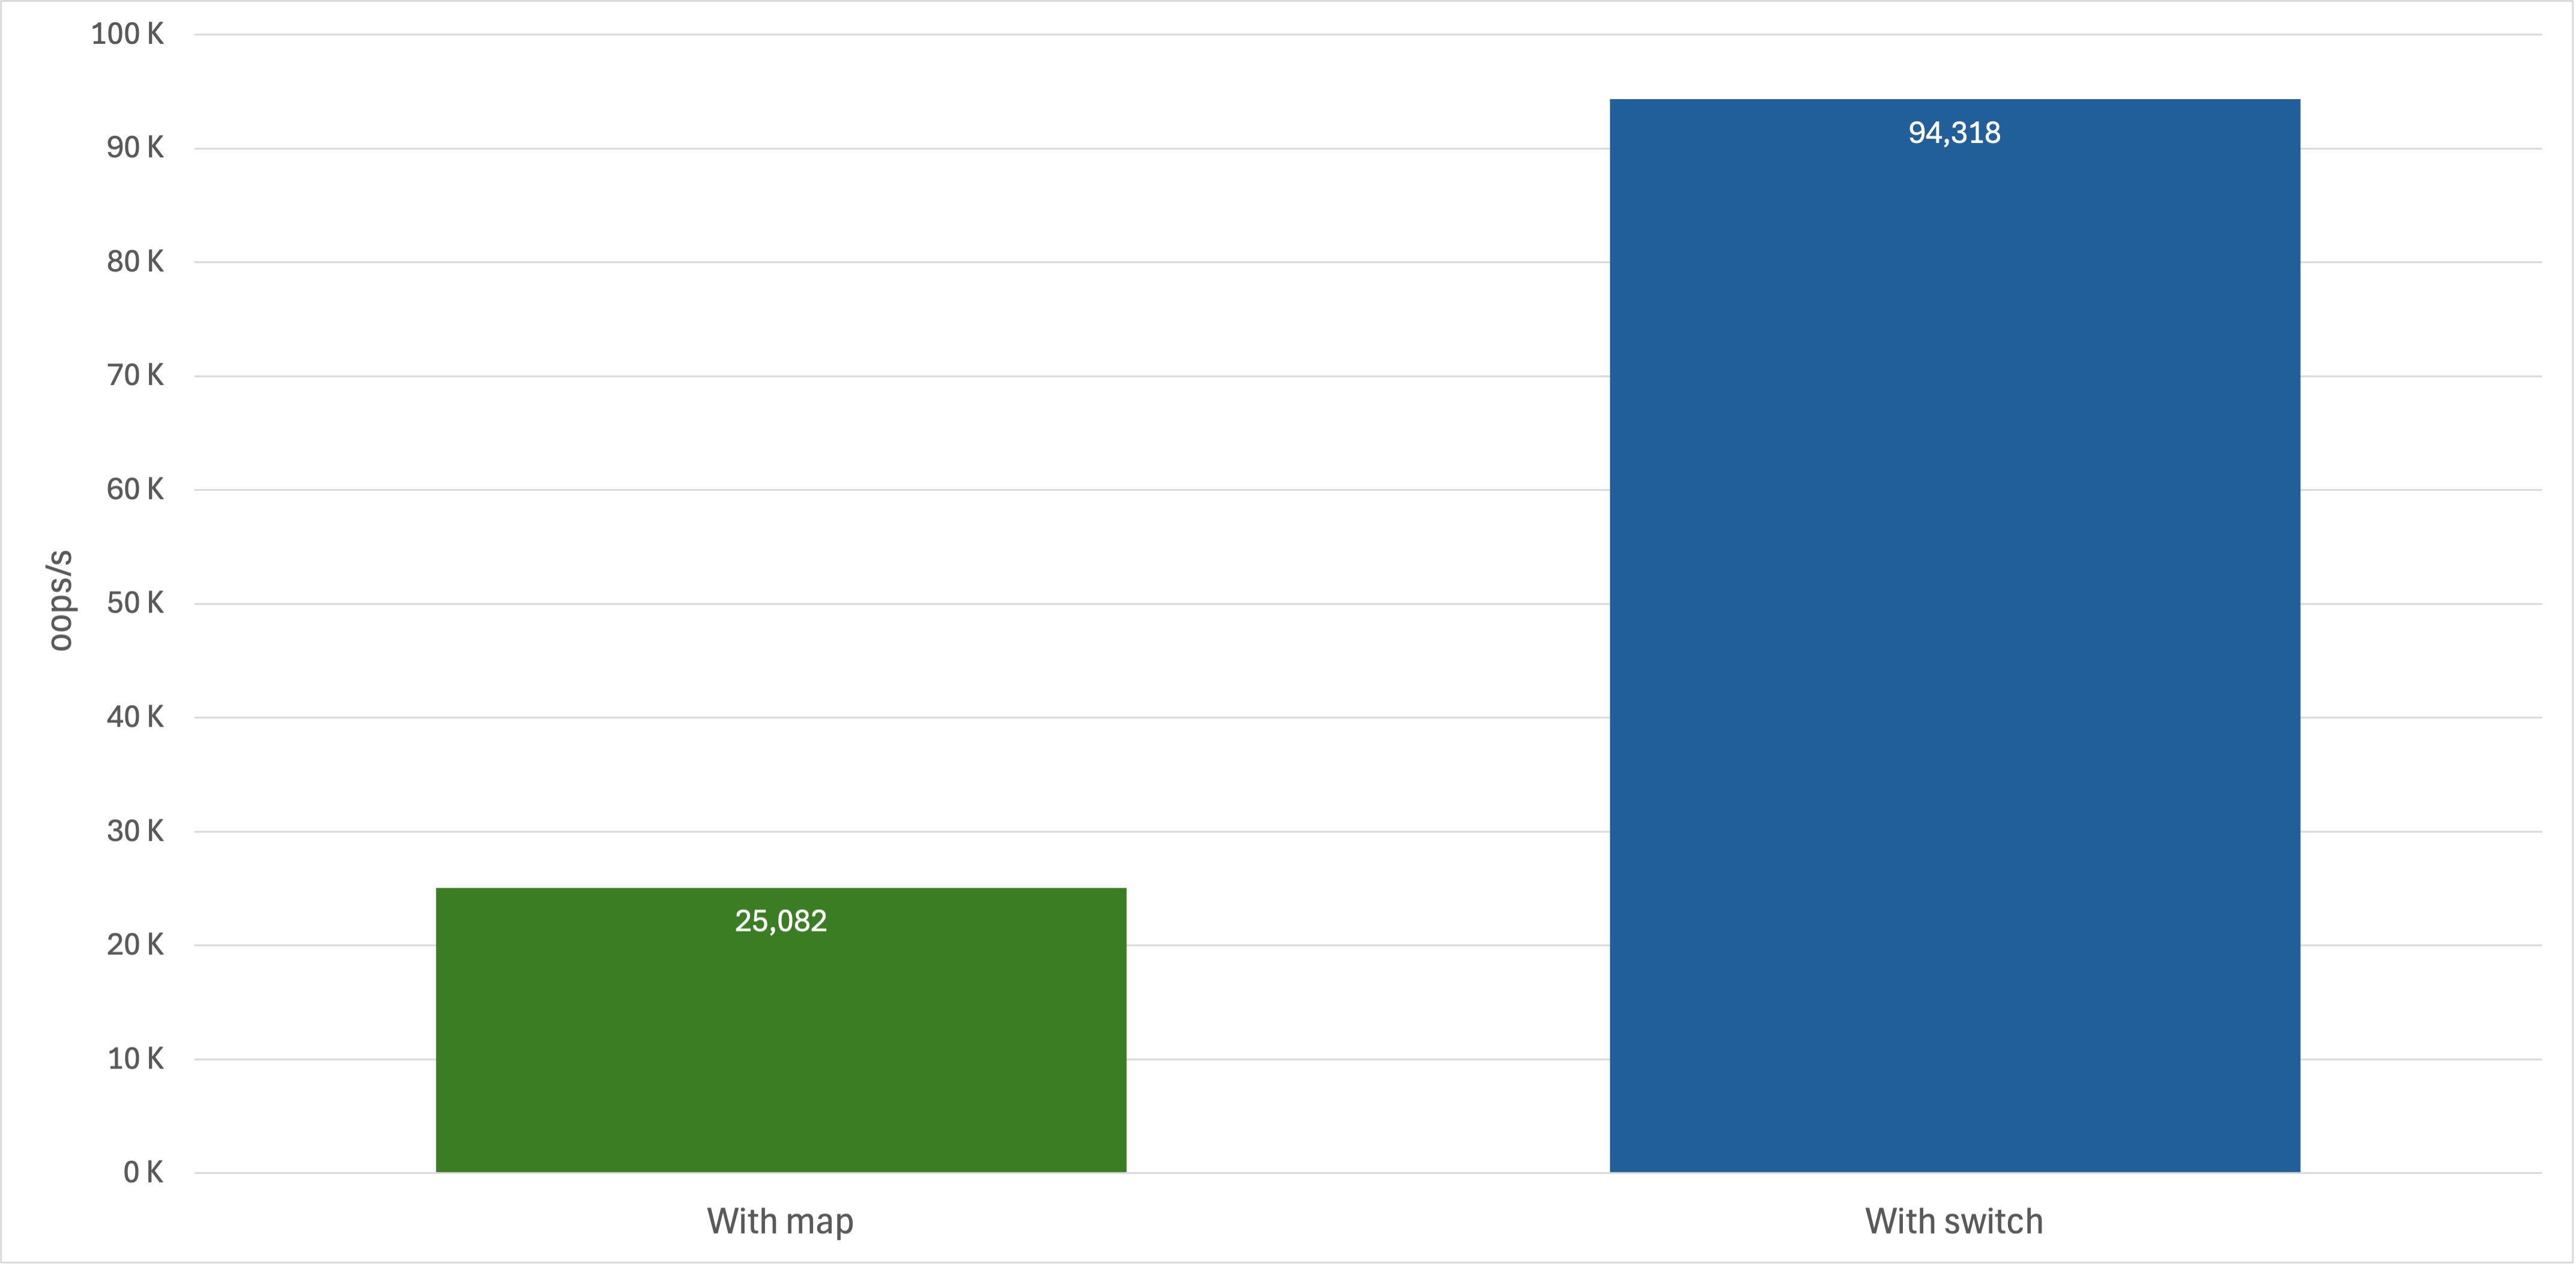
The JIT can inline these calls easily and often eliminate the dispatch overhead entirely. In my benchmark tests, this resulted in the Map approach achieving roughly 70% lower throughput compared to the switch implementation.
View used JMH Benchmark code
Disclaimer: The benchmark results comparing the Map based dispatcher and the switch based one come from microbenchmarks under controlled conditions. Actual performance in prod systems may vary depending on workload, JVM version, hardware, and other runtime factors. These results should be interpreted as illustrative of JIT inlining behavior rather than definitive measurements for all real-world scenarios.
Conclusion
Switching from a clean chain of responsibility dispatcher to a switch based one might seem appealing, especially in light of these results. However, as mentioned (a few times) earlier, this improvement applies only to a single method call. The real question remains: should you use a Map based dispatcher or a switch?
As with many decisions in a developer’s life, the answer is: it depends. If the number of types (such as our Event implementations) is fixed and small, a switch can be a solid choice. But if the set of types is dynamic and may change over time, the classic chain of responsibility approach still offers better flexibility and maintainability.
JIT inlining is a powerful optimization that can improve performance, mainly for small and frequently called methods. However, its benefits come with trade-offs such as increased code size, longer compilation times, and reduced flexibility in dynamic call sites.
Developers should structure code with these trade-offs in mind. Write clear, maintainable logic first and allow the JVM to optimize where it can. For fixed, small sets of types, direct dispatch (e.g., using a switch) can help the JIT inline effectively, while dynamic or extensible designs benefit more from flexible patterns like maps.
As Brian Goetz, Java Language Architect at Oracle, said: Write your code for clarity first, then tune it for performance. Understanding the limits and behaviors of JIT inlining allows your code to achieve better performance without sacrificing readability.

This work is licensed under a Creative Commons Attribuition-ShareAlike 4.0 International License .